Urban Climate
This lesson uses the SOLWEIG plugin for QGIS. The plugin is experimental: it requires QGIS 4.0 (or 3.99 nightly builds), is under active development, and you may encounter bugs or unexpected behaviour. Treat this module as optional.
If something goes wrong, report it on the SOLWEIG GitHub repository with steps to reproduce.
Heat stress is a measurable urban problem. The shape of streets, the height of buildings, the presence of trees, and the material of surfaces all affect how hot it feels at street level. Two spots 50 metres apart can differ by 10°C or more in perceived thermal comfort, depending on shade and surface radiation.
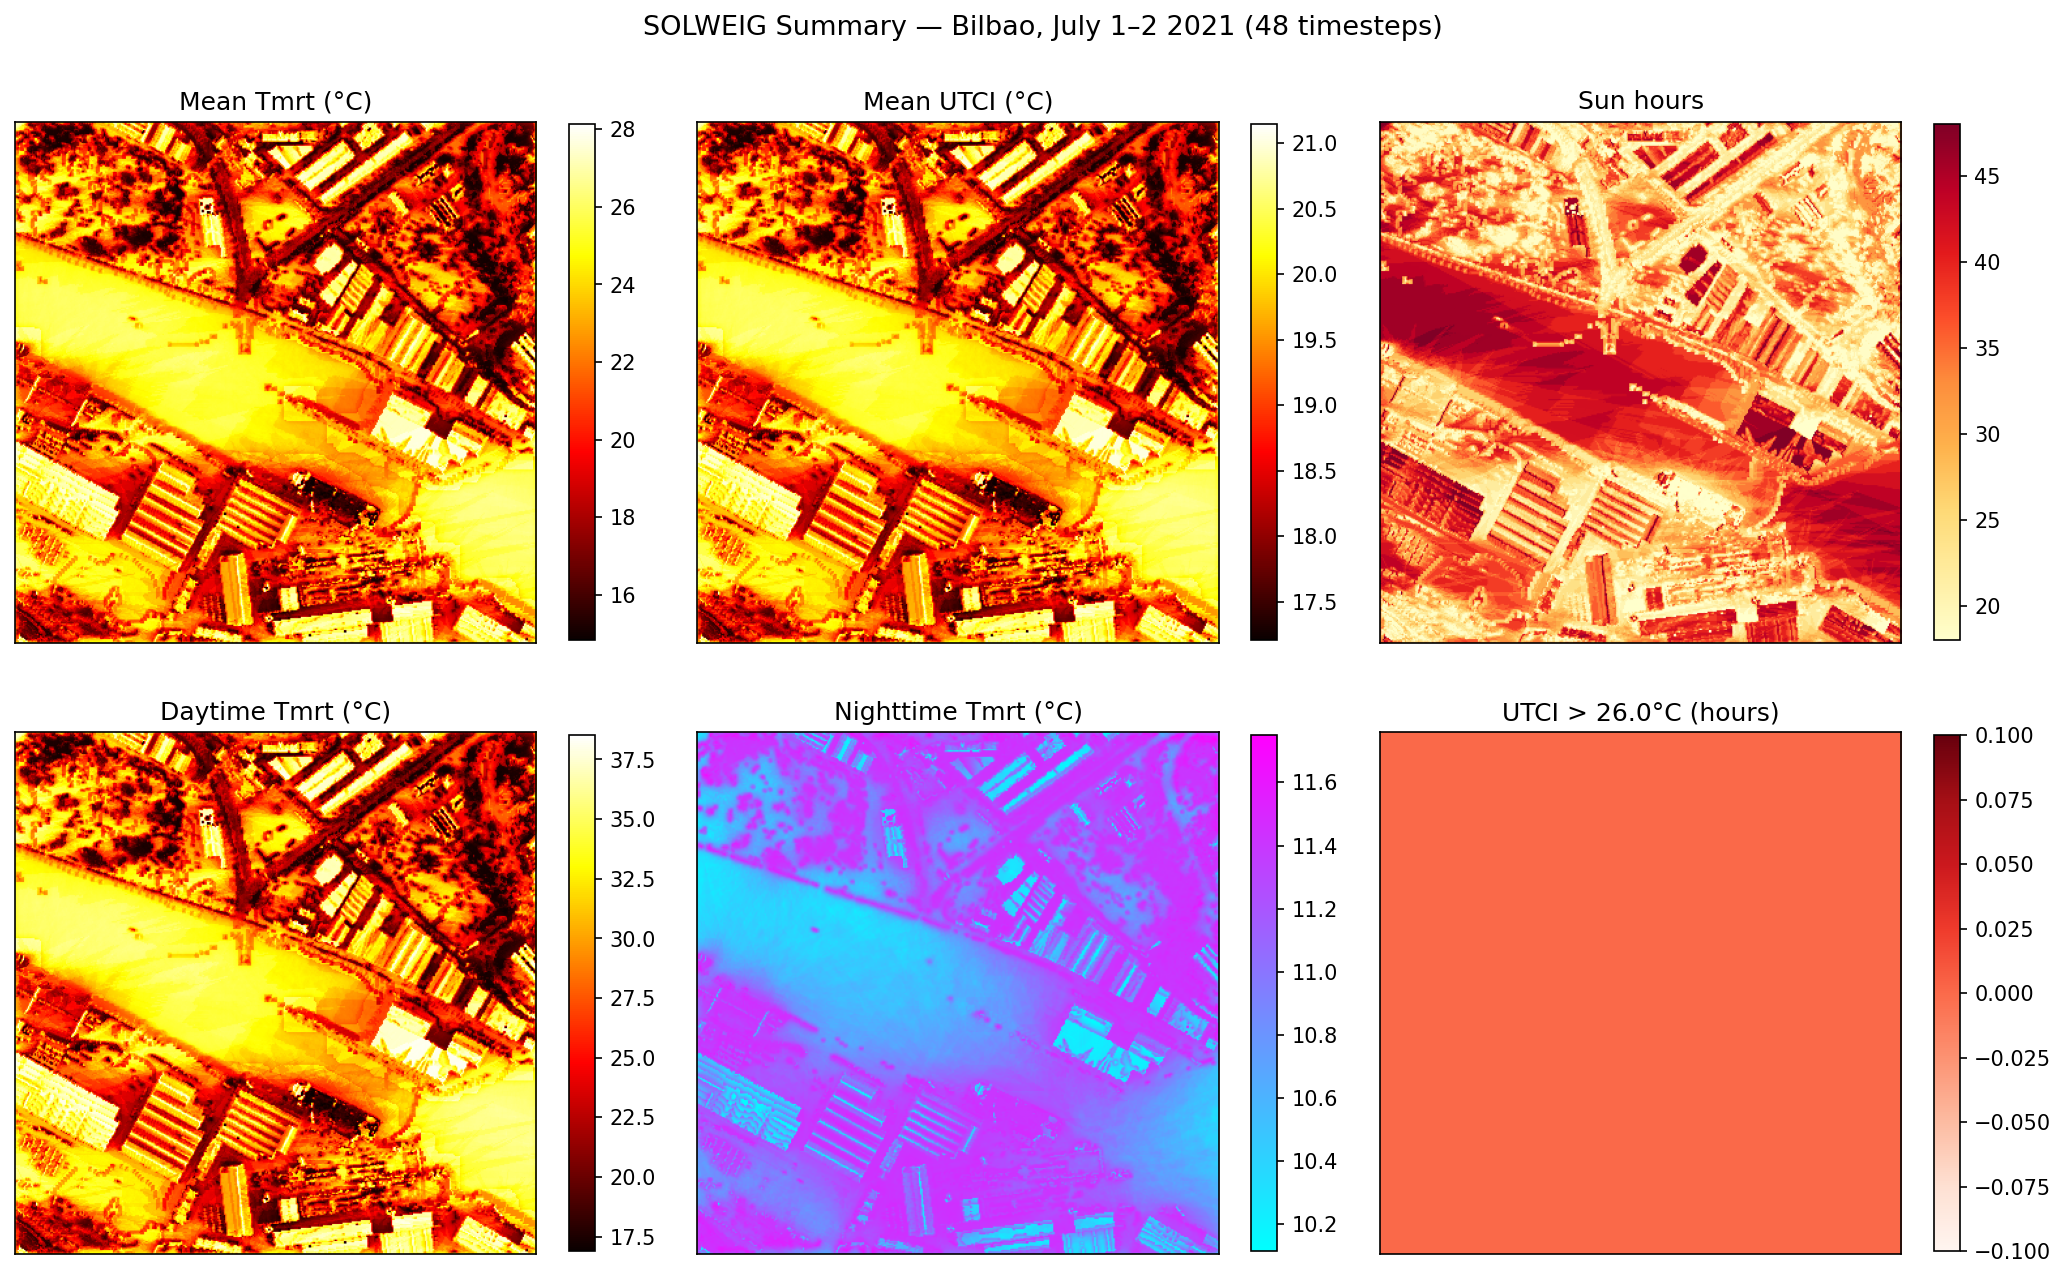
SOLWEIG (Solar and Longwave Environmental Irradiance Geometry) calculates Mean Radiant Temperature (Tmrt), which captures how much radiation a person receives from all directions: direct sun, reflected light from walls and ground, and longwave heat emitted by surfaces. From Tmrt, you can derive UTCI (Universal Thermal Climate Index), a standard measure of how hot it feels to a person standing in that location.
Your task: calculate Tmrt and UTCI for a 1km x 1km area of Bilbao’s old town during a summer heatwave, using LiDAR surface data and hourly weather observations.
What you’ll produce
- Shadow maps showing where buildings and terrain cast shade at different times of day
- Mean Radiant Temperature grids showing which locations receive the most radiation
- UTCI thermal comfort maps identifying areas of heat stress
Background reading
Lindberg, F., Grimmond, C.S.B., Gabey, A. et al. (2018). Urban Multi-scale Environmental Predictor (UMEP): an integrated tool for city-based climate services. Environmental Modelling and Software, 99, 70-87. DOI
SOLWEIG documentation: https://umep-dev.github.io/solweig/