flowchart LR
    A{QGIS Project File} -->|references| B{Layer 1: Shapefile}
    A -->|references| C[Layer 2: GeoPackage]
    A -->|references| D[Layer 3: GeoTIFF]
    A -->|references| E[Layer 4: CSV]
    A -->|references| F[Layer 5: PostGIS Database]
    A -->|references| G[Layer 6: XYZ Tile Service]
    A -->|references| X[Layer X: ...]

    B -->|contains| B1(.shp)
    B -->|contains| B2(.shx)
    B -->|contains| B3(.dbf)
    B -->|contains| B4(.prj)
Intro to QGIS
QGIS is free, open-source GIS software for Windows, Mac, and Linux. You’ll use it throughout this course to load data, style layers, create maps, and access powerful geoprocessing tools.
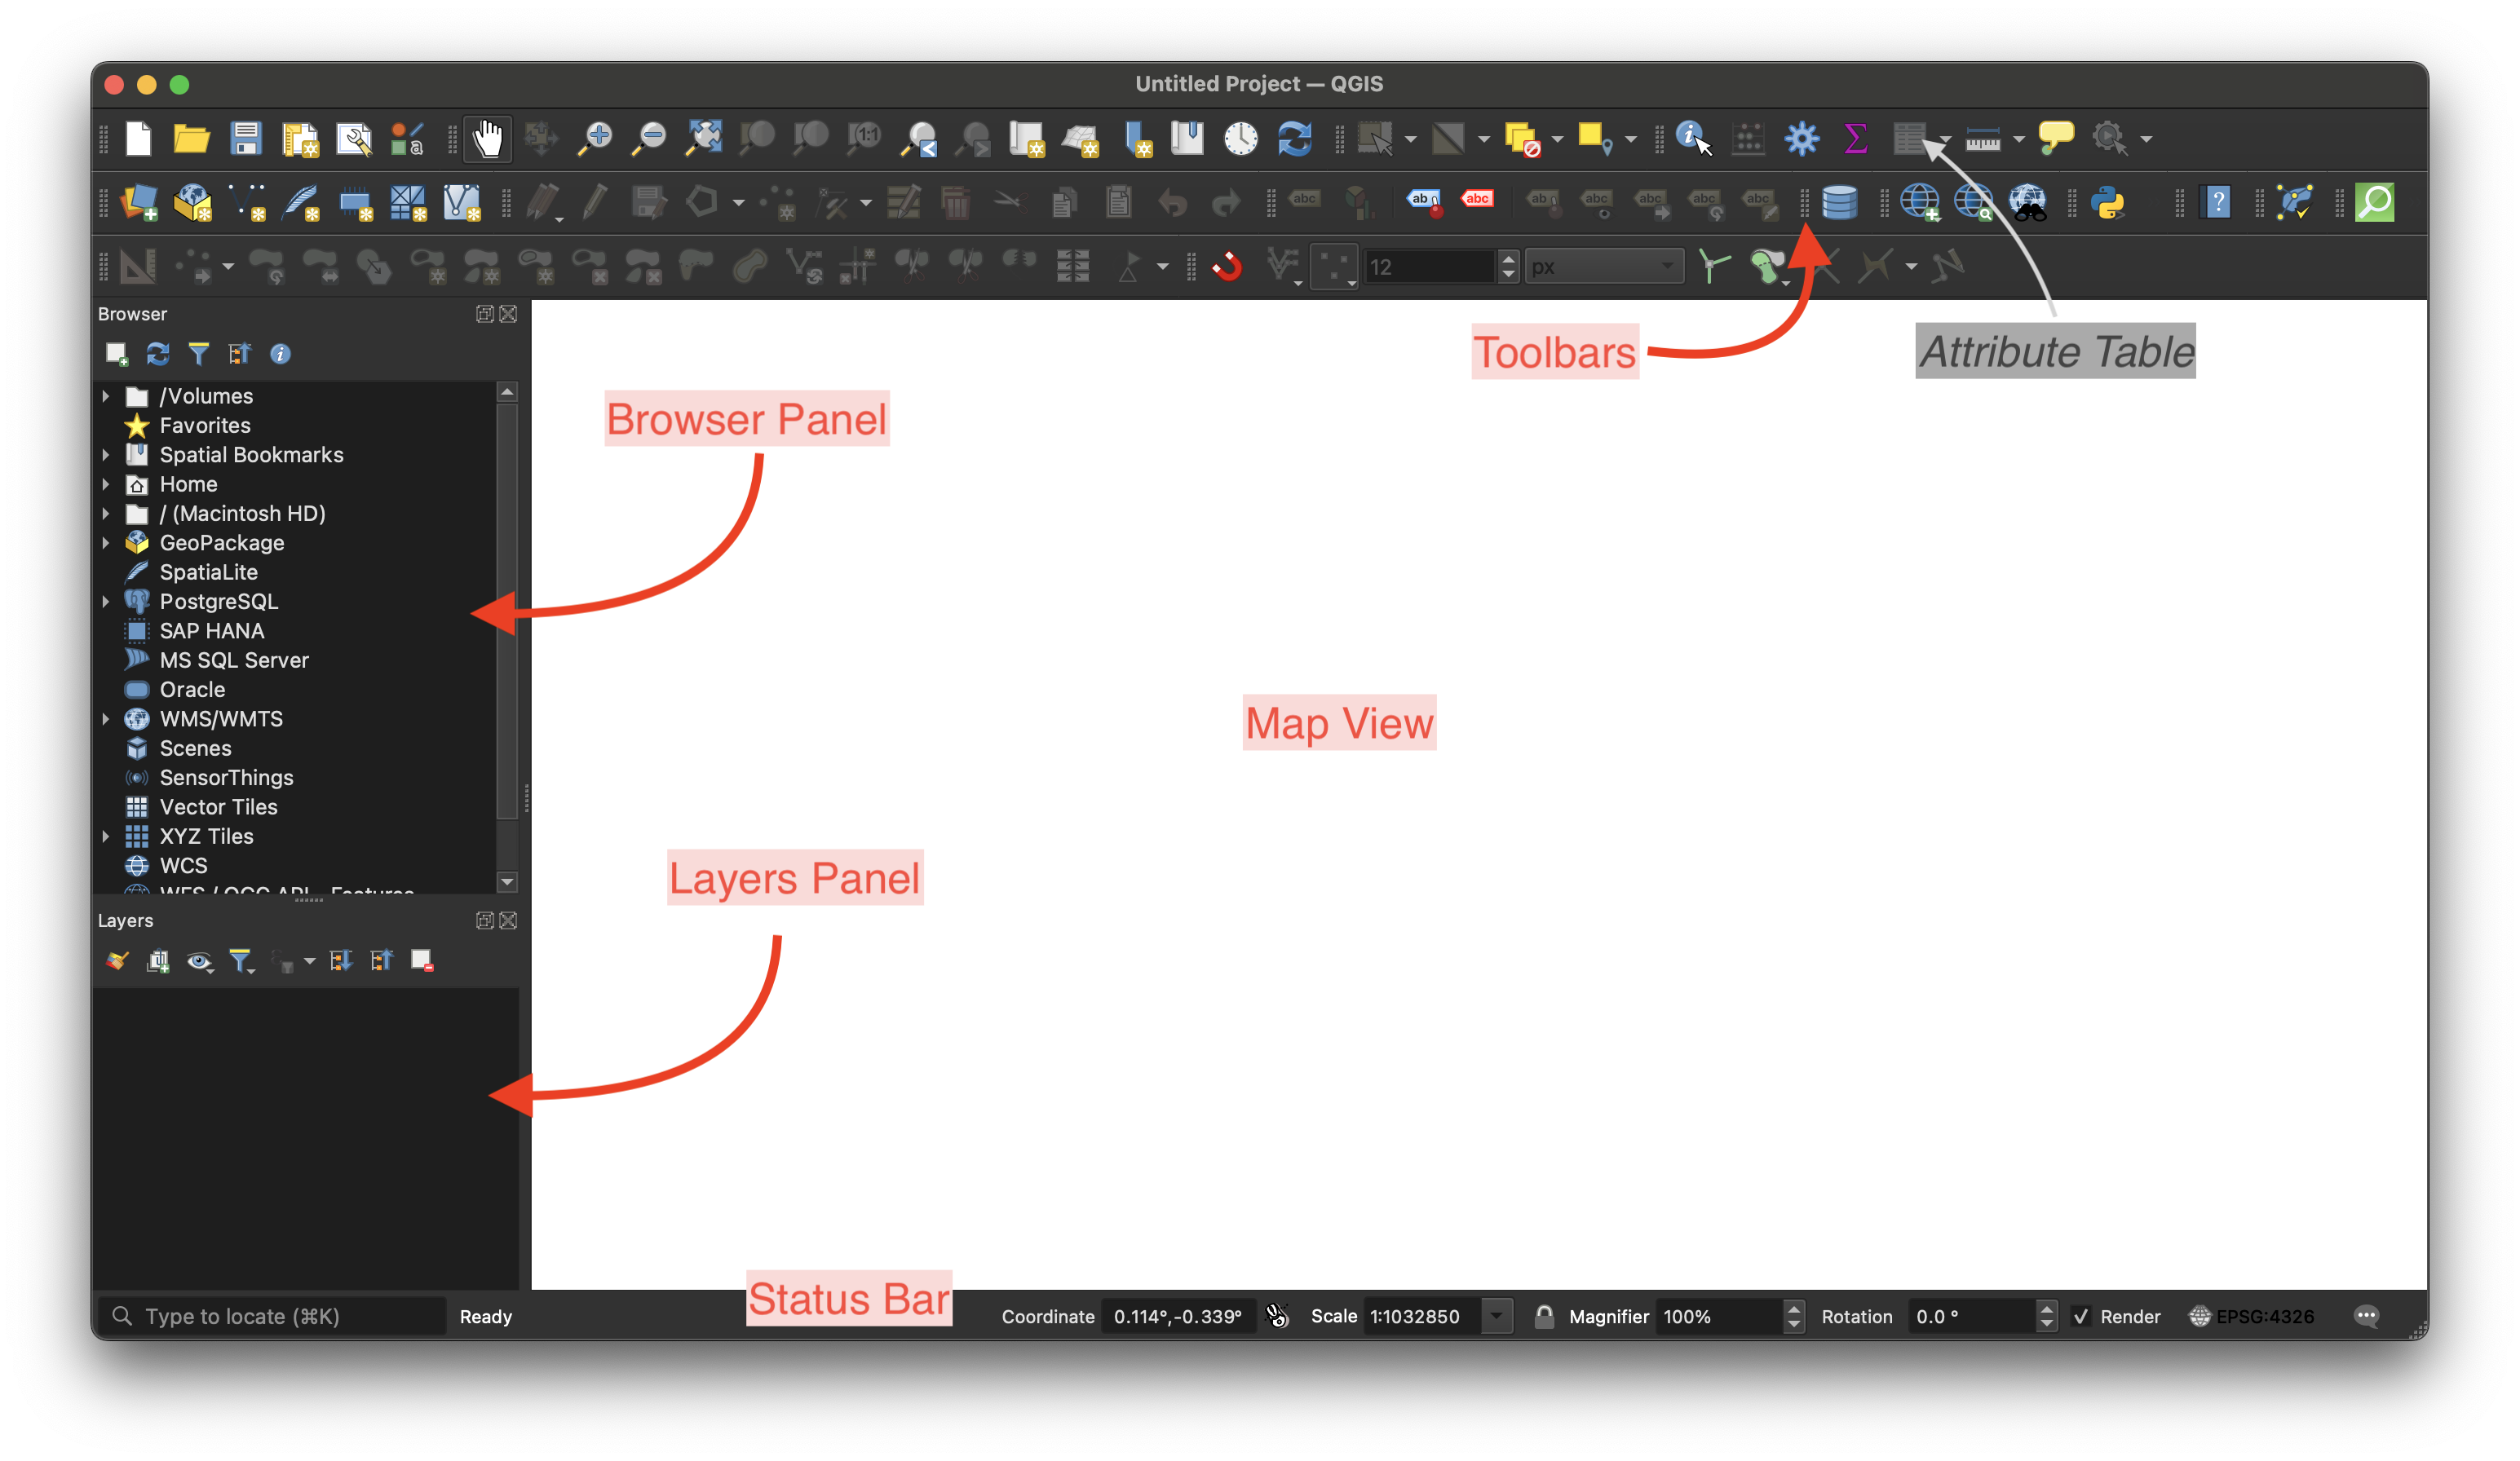
QGIS UI
The interface has several panels you’ll use constantly:
- Main Interface: The map area, toolbars, layers panel, status bar, dock panels.
- Toolbars: Quick access to common operations like zooming, panning, selecting, and editing. These can be customised.
- Map View: The central area where your layers are displayed. Navigate by zooming, panning, and clicking to identify features.
- Browser Panel: For loading data from your file system, databases, and web services.
- Layers Panel: Lists all layers in your project. Layers can be reordered, styled, and configured here.
- Attribute Table: View and edit the data associated with vector features.
- Status Bar: Shows the current map scale, coordinate reference system, and process messages.
- Processing Toolbox: Geoprocessing tools and algorithms. The list grows as you install plugins and create your own models.
Tip
Toolbars can be rearranged by dragging. If you accidentally close a panel, restore it from View → Panels.
NoteReading
Plugins
Plugins extend QGIS with additional tools: basemap services, specialized analysis, format converters. As an example, let’s install the Quick Map Services (QMS) plugin, which provides access to various basemaps:
Install the Quick Map Services (QMS) Plugin:
- From the
Pluginsmenu, selectManage and Install Plugins - Search for
QMS - Install
QuickMapServices InstallandClosethe window.
This plugin will add a new menu entry under the Web menu. (Different plugins may add their functionality in other toolbars or menus.)
- From the
Webmenu, selectQuickMapServices→OSM→OSM Standard.
You should now see a world map with OpenStreetMap tiles in your map canvas. If nothing appears, check that the layer is visible (checkmark in the Layers panel) and try zooming out.
NoteReading
Custom Shortcuts (Optional)
QGIS allows custom keyboard shortcuts. You won’t need these until you start editing data in the next module, but if you find yourself using certain tools repeatedly, shortcuts can speed up your workflow.
To configure: go to Settings → Keyboard Shortcuts..., search for an action (e.g., “Toggle Editing”), and assign a key.
XYZ Tiles
The QMS plugin provides convenient access to many tile services, but it doesn’t include everything. XYZ Tiles let you connect to a tile service directly using a URL. This is useful when you want basemaps available without relying on a plugin.
To establish a new connection:
- On the Browser panel, right-click on
XYZ Tiles->New Connection... - Assign a name to the connection (eg. OpenStreetMap).
- Paste the respective
URL.
You only have to do this once, in future you can double-click the layer to add it.
Note
We recommend you establish at least the following connections:
- OpenStreetMap :
https://tile.openstreetmap.org/{z}/{x}/{y}.png - Google Imagery Hybrid :
http://mt0.google.com/vt/lyrs=y&hl=en&x={x}&y={y}&z={z}&s=Ga
Tip
A useful list of tile servers: https://qms.nextgis.com. Take note of the reported status as not all URLs will currently work.
QGIS Projects
A QGIS project is a collection of data layers and settings like styling. The data files exist separately from the project: when you edit data in QGIS, you’re editing the source files directly. Saving the project saves your map view and layer settings, but the data layers themselves remain independent files on disk.
Example: QGIS project structure
Keep your projects and layers organised, and keep in mind that if you delete or rename a layer then your QGIS project will not be able to find the data. In these cases, you’ll need to recreate or relink your datasets.
- Go to
Project→Newto create a new project. - Go to
Project→Save, choose a location and name, and save for later reuse.
NoteReading
Coordinate Reference Systems
Geospatial data is represented using a Coordinate Reference System (CRS). QGIS will use a currently selected CRS (see the CRS code in the lower right corner of the status bar) to display your map data in the Map View.
The project CRS (for display) is separate from each file’s stored CRS. QGIS detects a file’s CRS when it opens. If the file uses a different CRS from the project CRS, QGIS will dynamically reproject the data so it displays correctly. This means you can open multiple files, each in a different CRS, and they’ll all align properly.
For this course, you’ll primarily use two CRS:
- EPSG:25830 (ETRS89 / UTM zone 30N): The standard projected CRS for Spain. Use this for your project CRS when working with Madrid data. Units are in metres, which makes area and distance calculations straightforward.
- EPSG:3857 (Web Mercator): The projected CRS used by most web maps (OpenStreetMap/Google-style tiles). It is convenient for basemaps, but it distorts area and distance and should not be used for measurement-based analysis. If you’re using web tiles and notice slow rendering when panning/zooming, temporarily switching the project CRS to 3857 can help because QGIS won’t need to reproject the tiles on the fly.
To change your project CRS:
- Click the CRS button in the lower right corner of the status bar
- Search for the EPSG code (e.g.,
25830) - Select it, click
Apply, thenOK
NoteReading
Check Your Understanding
A colleague emails you a shapefile of metro stations. The file is in EPSG:4326 (WGS84, the standard GPS coordinate system). Your project is set to EPSG:25830.
NoteQuestions
- When you load the file, will the metro stations appear in the correct location on your map?
- After loading, what CRS is the original shapefile stored in?
- You need to calculate the distance in metres between two stations. Can you do this directly, or do you need to do something first?
- Your colleague asks you to send back an edited version “in the same format.” What do you need to check before exporting?
TipAnswers
Yes. QGIS reprojects on the fly. The file’s CRS (4326) differs from your project CRS (25830), but QGIS detects this and transforms the coordinates for display. The stations will align correctly with your other layers.
Still EPSG:4326. Loading a file into QGIS doesn’t change the file itself. The original shapefile remains in its native CRS. On-the-fly reprojection only affects how it’s displayed.
Reprojection may be necessary. EPSG:4326 uses degrees, not metres. Some tools can calculate distances on geographic coordinates, but many assume projected units. When in doubt, reproject to 25830 (right-click → Export → Save Features As, selecting the target CRS).
Check the export CRS. When you export, QGIS defaults to the layer’s current CRS, but you can change it. If your colleague expects EPSG:4326, make sure you select that in the export dialog, not your project CRS.
Challenge
NoteChallenge
Set up your QGIS environment for working with Madrid data:
- Create a new project and save it as
madrid_intro.qgz - Set the project CRS to
EPSG:25830(the standard CRS for Spain, as explained above) - Add two XYZ tile connections: OpenStreetMap and one satellite imagery source of your choice
- Load an OSM base map and navigate to Madrid
When complete, your map should show Madrid and the status bar should display EPSG:25830.
TipSolution
Project→New, thenProject→Save As..., name itmadrid_intro.qgz- Click the CRS button in the lower-right status bar, search for
25830, select it, clickApplyandOK - In the Browser panel, right-click
XYZ Tiles→New Connection...:- Name:
OpenStreetMap, URL:https://tile.openstreetmap.org/{z}/{x}/{y}.png - Name:
Google Satellite, URL:http://mt0.google.com/vt/lyrs=s&hl=en&x={x}&y={y}&z={z}&s=Ga
- Name:
- Double-click
OpenStreetMapin the Browser panel to add it, then zoom out and pan to find Madrid in central Spain
The base map tiles may render slowly because QGIS is reprojecting them from 3857 to 25830. This is expected. If it becomes problematic, you can switch to 3857 for improved navigation.