QGIS Graphical Modeller
The QGIS Graphical Modeller packages sequences of processing steps into reusable models. Instead of running the same operations manually each time, you build a model once and run it on new data with a single click.
Models combine everything covered so far: joins, aggregations, spatial operations, and attribute manipulation. You can share models with colleagues so they can replicate your workflows without rebuilding them from scratch.
Keep in mind that this is an advanced tool and it will take some time to fully master its potential. For now, the main thing is to understand the concept of why it exists and how it can help on your project work.
Graphical Modeller Interface
To open the Model Designer, go to Processing → Model Designer.
You can also access this from the top of the Processing Toolbox panel.
Main parts
- Algorithms: A condensed version of what you have in your
Processing Toolbox - Inputs: The list of types of inputs the user needs to specify to run the model.
- Model canvas: The area where you build your model by dragging and connecting tools.
- Variables: (optional) A place to set local variables that can be accessed by any of the algorithms
- Save and Export buttons: Save your model file (.model3) locally, export as image, or export as a Python script.
- Edit Model Help: Document what your model does and how to use it.
Exported Python scripts include QGIS-specific libraries. Python workflows are covered in later lessons.
When to Use the Graphical Modeller
- Automating repetitive tasks: By creating models, you can automate repetitive GIS tasks, saving time and reducing the potential for human error.
- Ensuring consistency: Models ensure that the same steps are followed every time, leading to more consistent and reproducible results.
- Facilitating complex workflows: The modeller allows you to chain multiple processes together, enabling the execution of complex workflows with a single click.
- Calculating and comparing metrics for scenario testing: Use the modeller to efficiently calculate and compare different metrics for various scenarios.
Best practice
The modeller is a powerful tool for sharing processes with colleagues. However, to do so successfully you should have the following concepts in mind.
Some of these concepts apply not just for the QGIS Modeller but also more generally when developing and sharing code workflows.
Documentation
Think about the end user, which may be your future self. Describe the goal of the algorithm, the input parameters, the return output, and any considerations for reproducibility.
The Edit Model Help feature provides a structured format for documenting your workflow.
You can also add comments to each algorithm, similarly to commenting code in Python.
Documentation makes it easier to identify and fix issues in your models and update them as needed.
Simplicity
Prefer several simple, flexible models over one complex model. Keep models generalisable so they can work with different datasets and formats.
Models that balance simplicity with usefulness are easier to maintain and stay relevant longer.
Workflows in data
Many software platforms offer no-code workflow tools: ArcGIS ModelBuilder, CARTO Workflows, Tableau Prep, and Rhino + Grasshopper. These tools allow users to create complex data workflows through graphical interfaces without extensive programming knowledge.
Exercise
The workflows below come from previous lessons and can be transformed into reusable models.
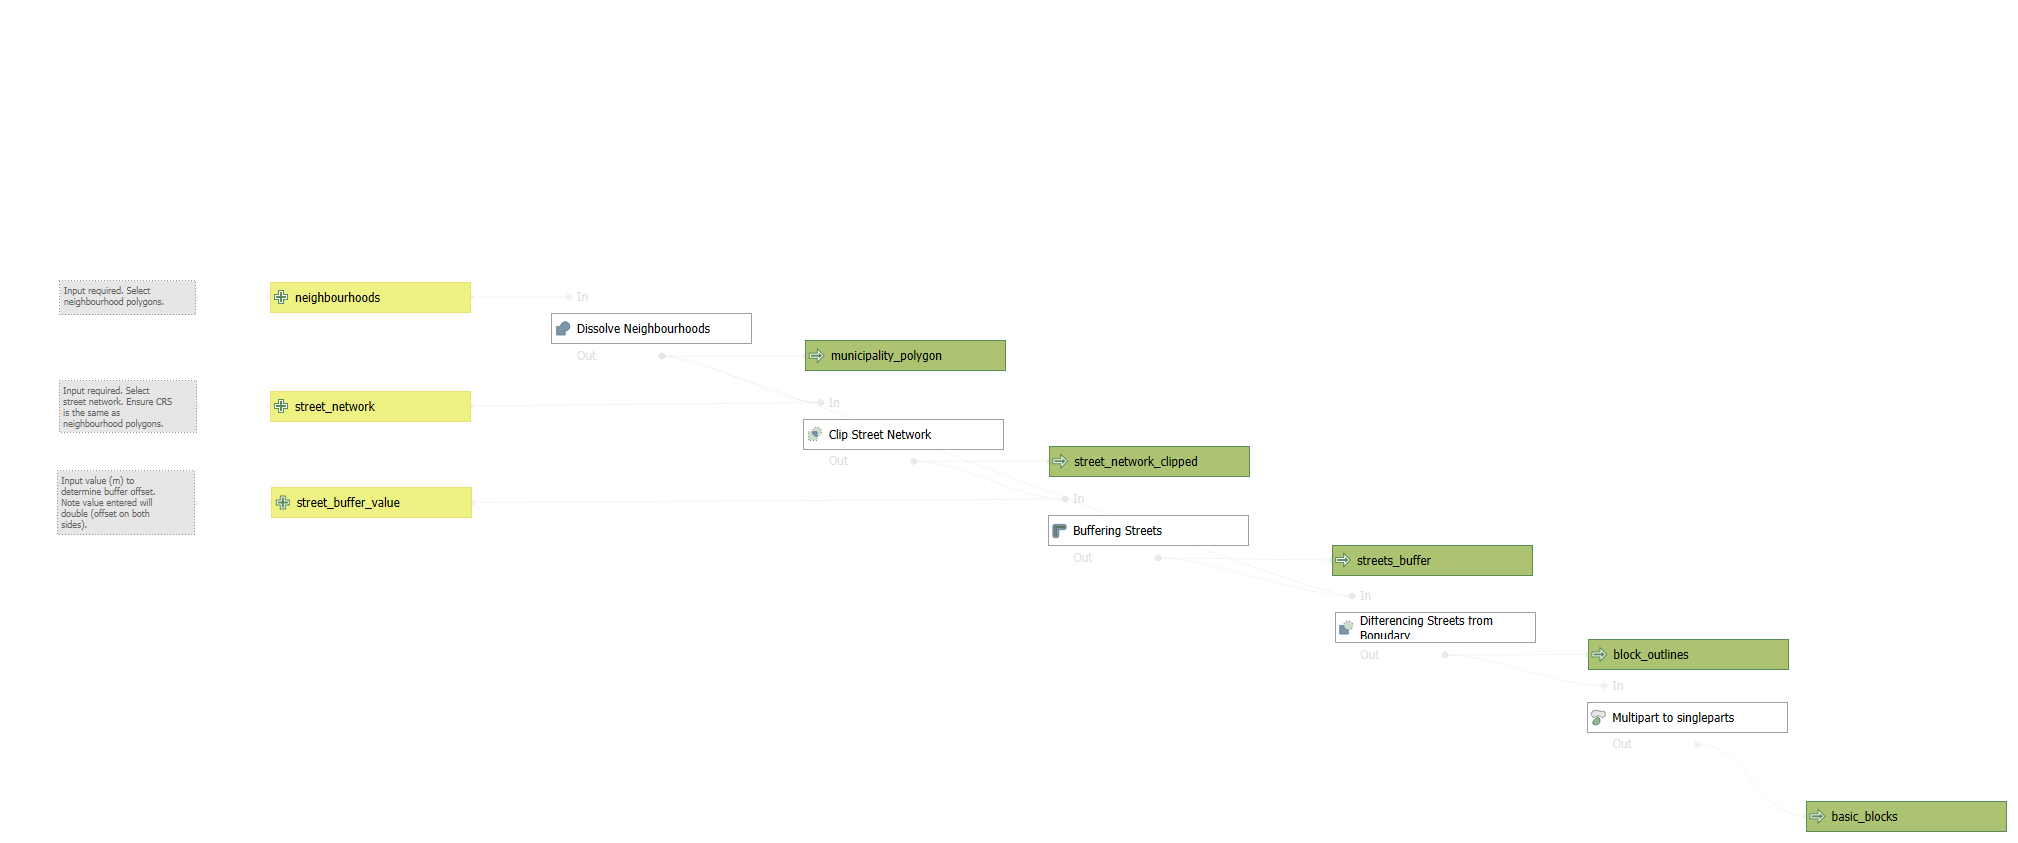
- Approximating Blocks:
- Dissolving Neighbourhoods
- Selecting Streets by Intersection
- Buffering Streets
- Dissolving Street Buffers
- Differencing Street Buffers from Boundary
- Multipart to Singleparts
- Cafeterias by Street:
- Buffering Streets
- Count Points in Polygon
- Join the Data
Build this model using the madrid_nbhds.gpkg and madrid_premises.gpkg datasets from the datasets page.
Process:
Open the Graphical Modeller (
Processing→Model Designer)Add Inputs:
- Select
Vector Layer:- Description : Streets
- Geometry Type:
Line - Leave ‘Mandatory’ as True
- Again select
Vector Layer:- Description : Premises
- Geometry Type:
Point - Leave ‘Mandatory’ as True
- Select
First Algorithm:
- Select
Buffer- Description: Buffer Streets
- Input Layer: Select
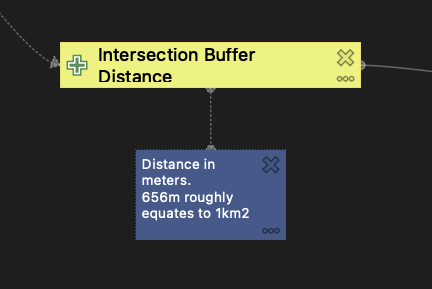
Model Input→Streets - Distance: 15 (metres, assuming EPSG:25830)
- Click
OK
- Select
Second Algorithm:
- Select
Join Attributes by Location (Summary)- Description: Count Premises in Buffer
- Input Layer: Select
Algorithm output→Buffer Streets - Join Layer: Select
Model Input→Premises - Geometric predicate:
intersects - Fields to summarise: select any field (e.g.,
fid) - Summaries to calculate:
count - Click
OK
- Select
Third Algorithm:
- Select
Join Attributes by Field Value- Description: Join Counts to Streets
- Input Layer: Select
Model Input→Streets - Table field:
fid - Input Layer 2: Select
Algorithm output→Count Premises in Buffer - Table field 2:
fid - For the Joined layer output, click the dropdown and select
Model Outputto mark this as the final result - Name the output:
Streets with Premise Counts - Click
OK
- Select
Save your model locally. You now have a reusable workflow that buffers streets and counts nearby premises.
Challenges
Using the provided city blocks model, create approximate blocks for your city.
Pay attention to CRS settings. After running the model, discuss what could be improved.
Create a model that automates the steps in the Spatial Aggregations section.