GIS Tips
Before diving into attribute editing and spatial analysis, this section covers three workflow essentials: managing styles so you don’t redo work, georeferencing images when you need to overlay non-spatial files, and exporting maps for use outside QGIS.
For these exercises, open your QGIS project from Lesson 1 with the Madrid neighbourhoods and buildings layers. If you don’t have it, load the madrid_buildings.gpkg and madrid_nbhds.gpkg datasets from the datasets page.
Saving Styles
In QGIS, a style includes symbology, labels, attribute table settings, and other display properties. Styles don’t change the underlying data. One layer can have multiple styles, letting you switch between different visualisations without duplicating the layer itself.
For example, you might want to show buildings coloured by height in one view and by construction date in another. Instead of loading the buildings layer twice, you create two styles and switch between them.
Managing Styles
Right-click any layer in the Layers Panel and look at the Styles submenu:
- Add: Creates a new style (starts as a copy of the current one)
- Rename Current: Give your style a descriptive name
- Remove Current: Delete a style you no longer need
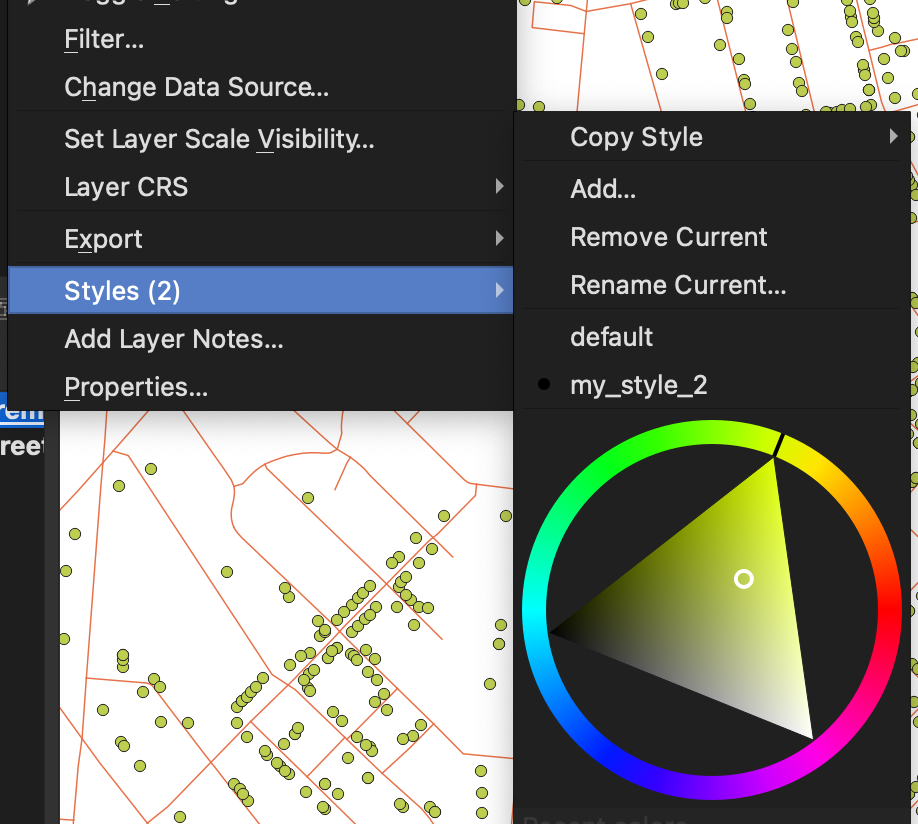
The first style is called “default” until you rename it. When you add a new style, QGIS switches to it automatically.
Saving Styles to Files
You can also save styles as separate QML files. This is useful when:
- You want to apply the same style to a different layer (e.g., buildings in a different city)
- You want to share a style with someone else
- You want to back up a style separately from the project
To save: right-click the layer → Export → Save as QGIS Layer Style File.
To load: right-click the layer → Styles → Load Style.
Exercise: Multiple Styles
- Select the buildings layer and open the Layer Styling panel (View → Panels → Layer Styling).
- Create a graduated colour scheme based on a numeric field (e.g., building height or area).
- Right-click the layer → Styles → Rename Current. Call it something like “By Height”.
- Right-click → Styles → Add. Create a different visualisation (e.g., categorised by a text field, or a simple single colour).
- Rename this new style appropriately.
- Switch between your two styles using the Styles submenu. Notice how the map updates instantly.
Georeferencing Images
Most raster data comes in geospatial formats like GeoTIFF that include coordinate information. QGIS automatically places these in the correct location.
Sometimes you’ll have an image without coordinate information: a scanned historical map, a planning sketch, or a screenshot. QGIS doesn’t know where to display it. Georeferencing solves this by assigning real-world coordinates to points in the image.
Common use cases:
- Historical maps: Overlay an old city plan to compare street layouts over time
- Site sketches: Place an architectural sketch onto its real-world location
- Satellite screenshots: Position imagery downloaded without metadata
How It Works
Open the Georeferencer via Layer → Georeferencer. The process:
- Load your image into the Georeferencer window
- Identify points on the image that you can locate on a reference map (street corners, building edges, landmarks)
- For each point, click on the image, then click the corresponding location on your main map canvas
- Once you have enough points, QGIS calculates a transformation that stretches and rotates the image to fit
Use at least 5 control points, spread across the image rather than clustered in one area. More points and wider distribution give better accuracy. Place points on features that haven’t changed (building corners are better than tree locations).
Transformation Settings
After adding control points, go to Settings → Transformation Settings:
- Transformation type: Polynomial 1 works for most cases. Higher orders handle more distortion but need more points.
- Target CRS: Match your project’s coordinate system.
- Output raster: Where to save the georeferenced image.
Click the green “Start Georeferencing” button to process. The result is a new GeoTIFF that loads in the correct position.
For quick, informal positioning (e.g., roughly placing a sketch for reference), the Freehand Raster Georeferencer plugin lets you drag and scale images directly on the map canvas without the full control point workflow.
Exporting Maps
QGIS offers two export paths: quick image export for simple needs, and print layouts for polished output.
Quick Export
Project → Import/Export → Export Map to Image (or PDF).
This captures the current map canvas. Key settings:
- Resolution: 96 DPI is fine for screen viewing. Use 300 DPI for print.
- Scale: Lock a specific scale (e.g., 1:10000) for consistency across exports.
- Extent: By default, exports the current view. You can set a custom extent.
Quick export works well for screenshots, quick shares, or embedding in documents where you don’t need legends or scale bars.
Print Layouts
For maps with titles, legends, scale bars, north arrows, or multiple map frames, use Project → New Print Layout.
Print layouts are separate documents within your project. You can have multiple layouts (e.g., one for an overview map, one for a detailed inset).
In a print layout, you add items to a page:
- Add Map: Draws the current map canvas (you can have multiple map items at different scales)
- Add Legend: Auto-generates from visible layers (customisable)
- Add Scale Bar: Shows map scale graphically
- Add Label: Text elements for titles, annotations, sources
Each item is independently positioned and sized. The map items link to your main project, so style changes update automatically.
Exercise: Export Your Map
- Style your buildings layer (use one of the styles you created earlier).
- Zoom to a neighbourhood you find interesting.
- Use quick export to save a PNG at 150 DPI. Check the file size and image quality.
- Create a new print layout (Project → New Print Layout, give it a name).
- Add a map item that shows your current view (Add Item → Add Map, then draw a rectangle).
- Add a legend (Add Item → Add Legend). In the Item Properties panel, uncheck “Auto update” and remove any layers you don’t want shown.
- Add a scale bar.
- Export to PDF (Layout → Export as PDF).
Compare your quick export PNG with the print layout PDF. The layout version takes more setup but produces output suitable for reports or presentations.